React INP Benchmark: Chunking vs startTransition vs scheduler.yield
A click during heavy React work waited 299 ms when synchronous and 330 ms with startTransition, but 12–13 ms with time slicing.
A user clicks a button that starts heavy work: filtering a large list, scoring rows, building a search index. While that work runs on the main thread, the next click waits, because the browser cannot handle input or paint until the work returns. Interaction to Next Paint (INP) measures that wait, and in data-heavy React screens it is usually the Core Web Vital that fails first.
The common answers are startTransition, slicing the work with setTimeout, yielding with scheduler.yield(), or a library that does the slicing for you. I maintain one of those libraries, react-inp-chunker, so I wanted numbers rather than claims. This article walks through a small benchmark that runs the same work five ways and measures how long a click made during that work waits.
The setup
The workload scores 20,000 rows, with 30 rounds of string hashing per row, then sorts the results and shows the top 25. Every version does exactly the same work. Only the scheduling differs:
| Version | How the work is scheduled |
|---|---|
| Synchronous | Scores every row inside the click handler. |
| setTimeout chunks | Hand-written 5 ms slices, yielding with setTimeout(0). |
| startTransition | Wraps the state update in a transition; the scoring runs during render. |
| react-inp-chunker | useChunkedTask(rows, scoreRow): 5 ms slices, yielding with scheduler.yield(). |
| scheduler.yield | Hand-written 5 ms slices, yielding with scheduler.yield(). |
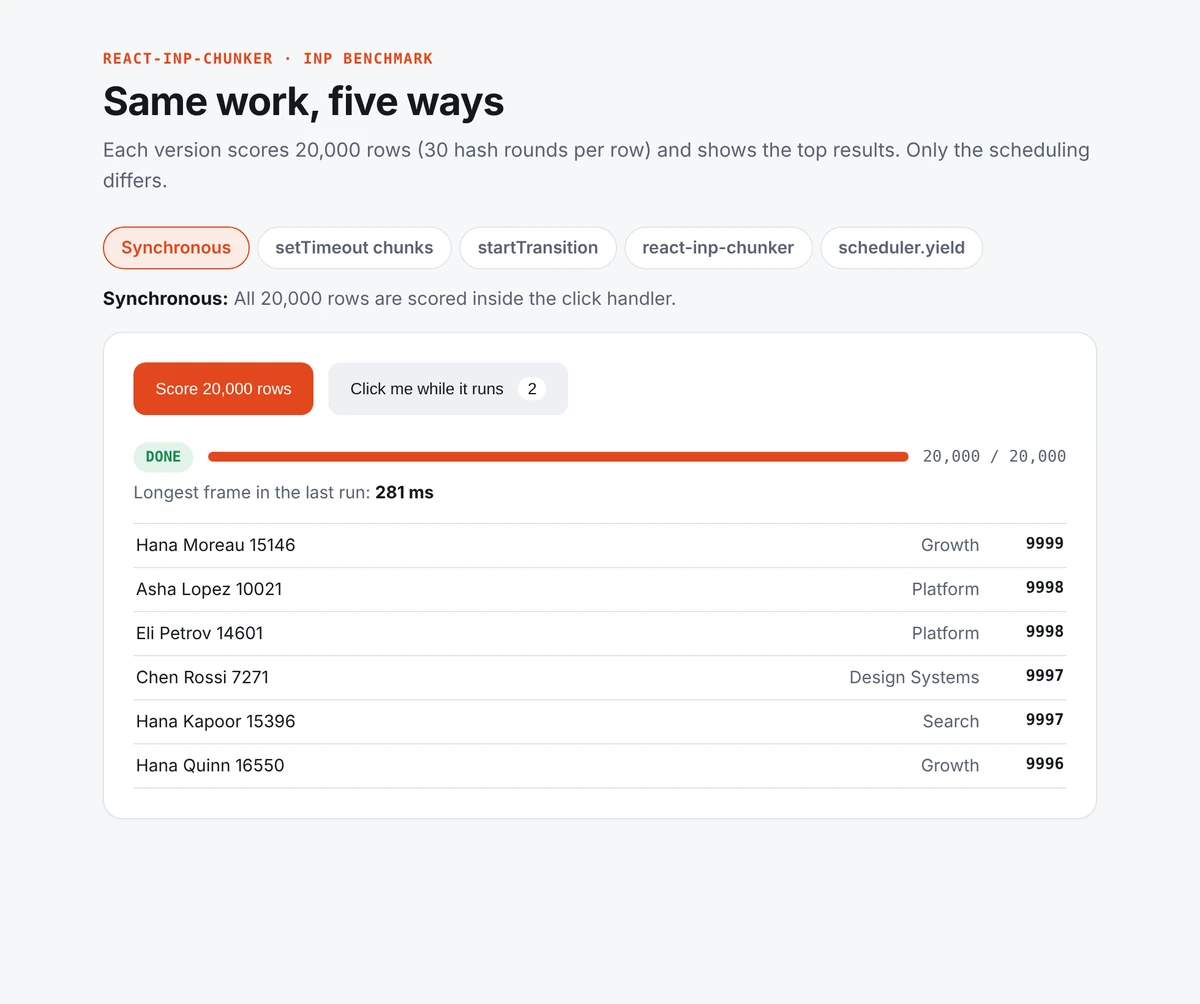
Each run clicks Score 20,000 rows, then clicks a second button 50 ms later, while the rows are still being scored. For both clicks, the app records the time from the click event to the next animation frame: the earliest moment its response can paint. That is the delay INP measures, recorded without the 16 ms reporting threshold of the Event Timing API. The app also records the longest frame during the run and the total time until the results are on screen.
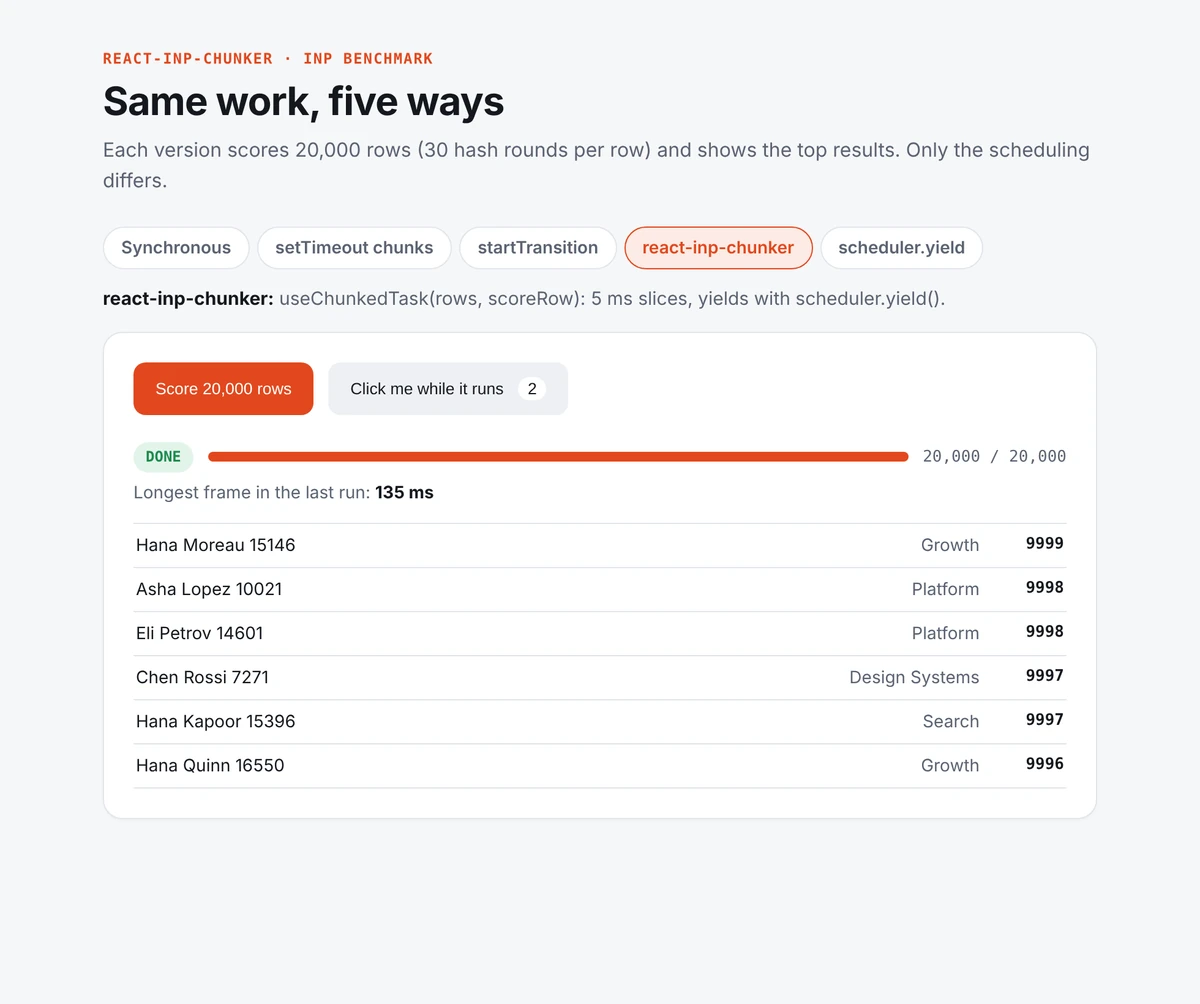
The numbers below come from headless Chromium 141 on a 2-core cloud VM with 4x CPU throttling: 30 runs per version after 3 warm-up runs. Absolute values depend on the machine. The benchmark folder has the code, the method and every raw sample, so you can run it on yours.
Results
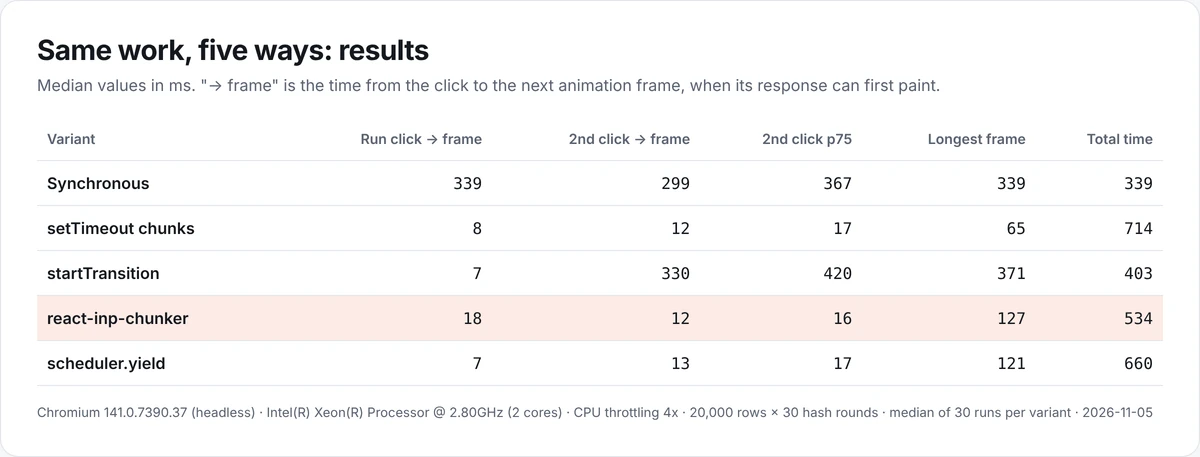
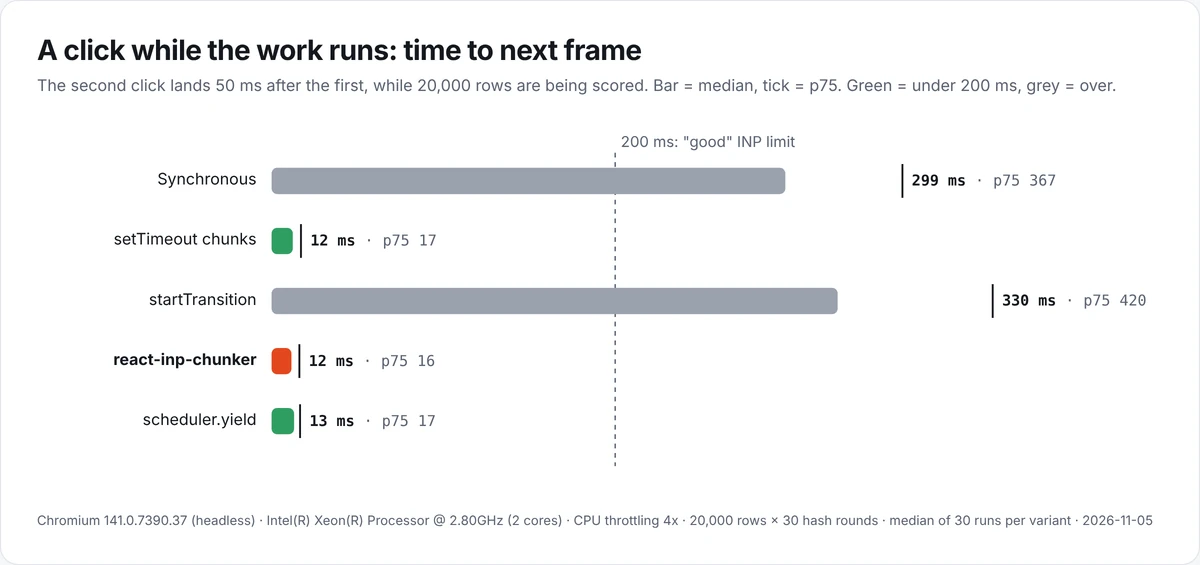
The main finding: a click made while the work runs waited a median of 299 ms in the synchronous version and 330 ms with startTransition, both above the 200 ms limit for a good INP. All three time-sliced versions kept that click at 12–13 ms, close to a single frame.
Why startTransition did not help here
startTransition did what it promises for the first click. The click that starts the work reached the next frame in a median of 7 ms, against 339 ms for the synchronous version, because React treats the update as non-urgent and lets the browser paint first.
The second click is where it fails. In this version the scoring runs during render, inside useMemo, which is how a lot of real code computes derived data. React can interrupt a transition between components, but it cannot pause in the middle of one component’s render. A single render that does all the scoring is one long block of work, and the click that arrives during it waits for all of it: 330 ms at the median and 420 ms at p75.
Transitions help when the cost is spread across many components, such as a large tree re-rendering after a filter changes. They do not split one expensive computation. For that, the computation itself has to yield.
The trade-off: yielding costs total time
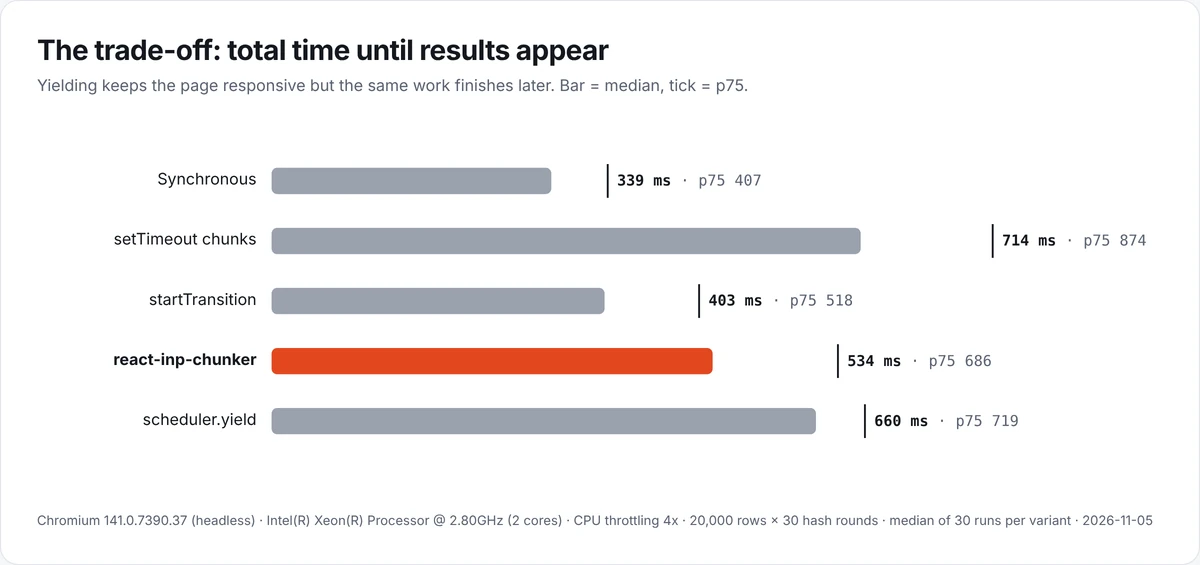
Yielding is not free. Every slice hands the main thread back to the browser, and the work only resumes when the browser schedules it again, so the same work finishes later. The synchronous version showed its results after a median of 339 ms. The time-sliced versions took 534 ms with react-inp-chunker, 660 ms with hand-written scheduler.yield(), and 714 ms with setTimeout.
setTimeout is the slowest because browsers clamp nested timers: once timers are nested several levels deep, setTimeout(fn, 0) waits at least 4 ms. With 5 ms slices of work, a 4 ms minimum wait after each slice adds up quickly. scheduler.yield() is built for this case: the work resumes ahead of other queued tasks.
The gap between react-inp-chunker and hand-written scheduler.yield() looks large in a chart of medians, but it is within run-to-run noise here; the individual runs of the two versions overlap widely (see results.json). This benchmark does not show either one finishing faster. The claim it supports is narrower: the library gives the same responsiveness as a hand-written scheduler.yield() loop, without writing and maintaining that loop yourself.
One more limit shows up in the longest frame. The final sort of 20,000 results is still one block of work, so the longest frame stays at a median of 121 ms with scheduler.yield() and 127 ms with react-inp-chunker; the setTimeout version’s median was 65 ms. Slicing only helps with the work you slice.
What to use when
- Small work needs nothing. If an update takes a few milliseconds, scheduling adds complexity and total time for no gain. Measure first: a task over 50 ms is a long task.
- Move heavy computation out of render. In the
startTransitionversion, the work sat inuseMemo, so it ran during render, where React cannot split it. Run it from an event handler or an effect instead, and keep render cheap. - Use
startTransitionfor expensive rendering, when the cost is spread across many components. - Chunk long loops over data. When the work is one function applied to many items, slice it and yield between slices.
A hand-written version of that loop looks like this:
async function scoreInSlices(rows: readonly Row[]) {
  const scored: Scored[] = [];
  let index = 0;
  while (index < rows.length) {
    await scheduler.yield();
    const start = performance.now();
    while (index < rows.length && performance.now() - start < 5) {
      scored.push(scoreRow(rows[index]));
      index += 1;
    }
  }
  return scored;
}
It still needs a fallback for browsers without scheduler.yield(), progress state for the UI, cancellation, and cleanup when the component unmounts. With react-inp-chunker, the same work is one hook:
import { useChunkedTask } from 'react-inp-chunker';

function ScoredRows({ rows }: { rows: readonly Row[] }) {
  // scoreRow runs once per row, in slices of up to 5 ms.
  const task = useChunkedTask(rows, scoreRow);

  if (task.isError) return <p role="alert">Couldn't score the rows.</p>;

  if (task.status !== 'done') {
    return (
      <progress
        value={task.processed}
        max={task.total}
        aria-label="Scoring rows"
      />
    );
  }

  return <ResultsTable scores={task.results} />;
}
The hook re-renders with progress once per slice, not once per item, and cancels when the component unmounts. A new rows array reference restarts the task, so memoize derived arrays. The documentation covers the full API and when to reach for something else, such as a Web Worker.
Limits of this benchmark
- One machine. A 2-core cloud VM with 4x CPU throttling. Your numbers will differ, so check the comparison on your own hardware.
- One browser, headless. Chromium 141 supports
scheduler.yield(). Browsers without it use a fallback, which this run did not measure. - A synthetic workload. String hashing costs the same for every row. Real work varies per item and touches memory differently.
- Lab numbers, not field INP. The benchmark measures click to next frame in a controlled run. Real INP comes from real users on real devices, while the rest of the page is also doing work.
To see what your users experience, collect INP in the field, for example with the web-vitals library, and judge it at the 75th percentile, which is how Core Web Vitals are assessed. To test the benchmark itself on a real phone, open the preview build on the device and use DevTools remote debugging.
Run it yourself
The benchmark README has the full method. From a clone of the repository:
cd bench/inp-demo
npm install
npm run build
npm run preview          # keep running, http://localhost:4173/
In a second terminal:
npx playwright install chromium   # once
npm run measure                   # writes results/results.json and RESULTS.md
npm run report                    # writes the charts, table and screenshots
Settings are environment variables: RUNS (default 30), WARMUP (3), CPU_RATE (4), WORK (30 hash rounds per row), PING_DELAY_MS (50), and HEADED=1 to watch the runs. The react-inp-chunker case study covers why the library exists and how it is tested.